Everybody has one.
Good ol’ “VM inventory report”
The moment your infrastructure outgrows kindergarten size of ~50 VMs, you either start exporting list of VMs from Web/vSphere Client on regular basis, or you search Internet for a Power CLI script to do it for you (and you will most certainly come across the “canonical” vCheck tool-set, that Artur wrote about years ago).
Better yet, if you start developing your own script.
Even if it’s a simple oneliner of get-vm | select … | export-csv I bet you have a report like that, and that’s a good thing.
Then with the grow of your infrastructure (or you moving up with your career), the report also grows to accommodate more and more information.
In addition to simple “number of vCPUs and RAM size” you add disk space usage, VMTools status and so on and so forth, you can go really creative with this.
Further down the road, you finally introduce vRealize Operations Manager into your infrastructure.
And this is by all means a great tool, even in Standard version it comes with lots of “out-of-the-box” reports about your VMware infrastructure.
If you’re lucky enough to use Enterprise version, you can create your own, customized reports and so a temptation may arise, to completely replace the “good ol'” scripted report with something you created in vROps.
In fact VMware encourages you to do so, one of the many advantages of vRealize Operations report will be for example, that such report is typically created much faster, than relatively slow iteration through all of your VMs, especially if your infrastructure consists of hundreds of hosts and thousands of VMs.
I on the other hand am rather lazy person and I honestly believe, that you shouldn’t try fixing something that isn’t broken.
I also don’t mind my “inventory report” to run for an hour or so, since I have it scheduled for Sundays and mailed to me automatically first thing in the Monday morning.
What I was looking for, was rather a way to extend the information already available from vCenter via PowerCLI, with what vROps can provide, especially the sizing recommendations (recommended number of vCPU and amount of RAM) generated by vROps analytics engine.
It wasn’t all that easy, as vROps was missing PowerCLI cmdlets until PowerCLI release 6.0R2, but then there was a light at the end of a tunnel.
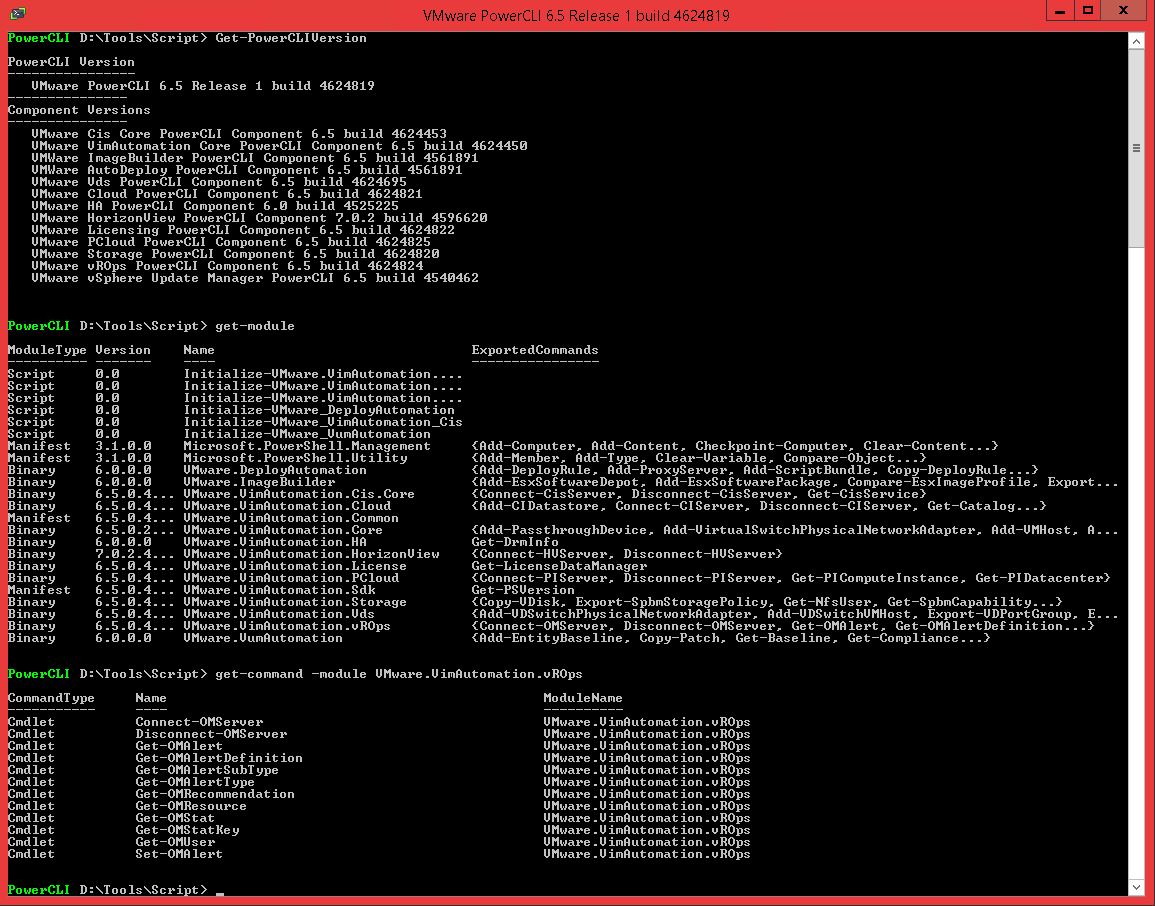
vROps related cmdlets, PowerCLI 6.5R1.
And personally I was oh, sooo happy to see these cmdlets, I naively believed that single Get-OMRecommendation will be the “ultimate answer” to all my questions.
I was hoping, that I could use it against any “VM object” and get “vROps recommended” vCPU and RAM sizings for the VM in question.
The greater my disappointment, when it turned out that above cmdlet only retrieves “vROps recommendation” from an active “vROps alert”, and only if any Recommendation is (pre)defined for this particular Alert.
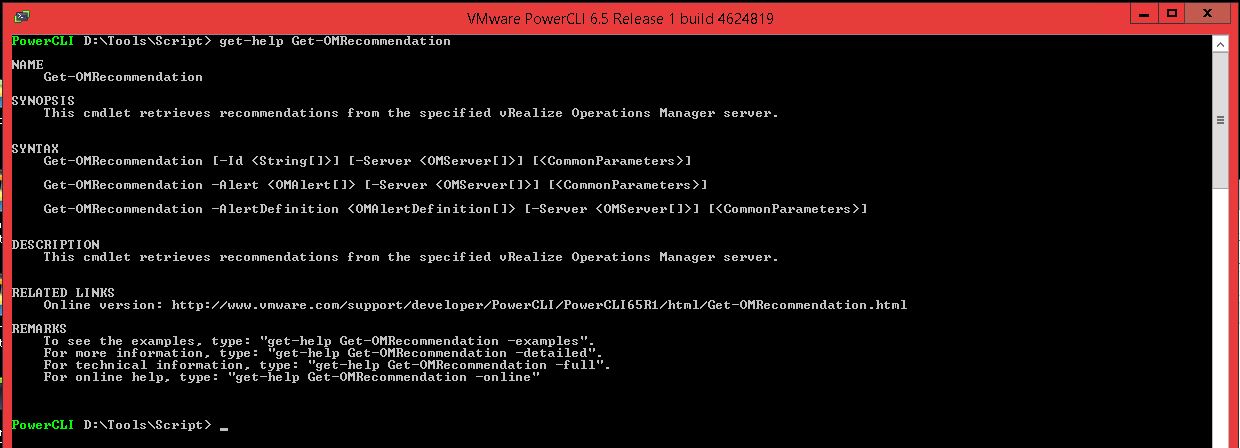
Get-OMRecommendation.
After some more reading I learned, that in fact there is no direct counterpart of “VM object” (as we know it from using vSphere related cmdlets) in vROps realm.
Instead a “Resource object” can be created to represent any entity that vROps is gathering Metrics for.
If for example, we want to retrieve all vROps alerts for a given $VM, a pipeline like the one below can be used:
$VM | Get-OMResource | Get-OMAlert
Then I realized, that (even with “Standard” license!) we are able to create custom Alerts and Recommendations in vROps, so my reasoning went down the following path:
(Obviously) I’m most interested in “oversized” VMs, so I will create a customized Alert triggered when (say) vROps “Recommended number of vCPUs to Remove“ Metric is greater than one, then I’ll pass the actual “vCPU delta value” to customized Recommendation and going back to my “inventory script” I will retrieve this Recommendation
(with Get-OMRecommendation!), to finally output it to a file (CSV, of course!).
I planned to use the same trick for RAM assignment, using “Reclaimable Capacity (KB)“ Metric.
That sounded easy enough, but it turned out that (let’s stay with vCPU example) I wasn’t able to “pass” numeric value, by which vCPU count should be decreased, to the custom Recommendation.
Not sure if this is possible at all, so if anyone of you knows how to do that – please share your experience in the comments!
Instead of trying to retrieve “exact numbers” for vROps compute capacity hints, I had to fail back to group these values into “buckets”, or “value ranges”.
Continuing with example of “vCPUs to Remove“, I decided to create three separate, custom Alerts for VMs that are (vCPU-wise) over-sized.
One alert triggered when “vCPUs to Remove” is greater than 2, second when value of this property is greater than 4 and last one when it is greater than 8.
This is where I stopped, but you can iterate these Alert definitions as far as you want, depending how many vCPUs you assign to your largest VMs.
The logic behind it is, that if, say, vROps recommends 9 vCPUs to be removed from given VM, all three Alerts will be triggered (-gt 2, -gt 4 and -gt 8).
Then I can simply count them upon retrieval via PowerCLI and deduct, that if there is only one of these (specific, custom kind) Alerts triggered, I can safely – of course offline, but without negatively impacting the workload – remove (at least) 2 vCPUs.
If there are two of Alerts present – I can remove 4 vCPUs and when all three are triggered, I can downsize the VM by (at least) 8 vCPUs.
Let me show you an example definition of such custom Alert.
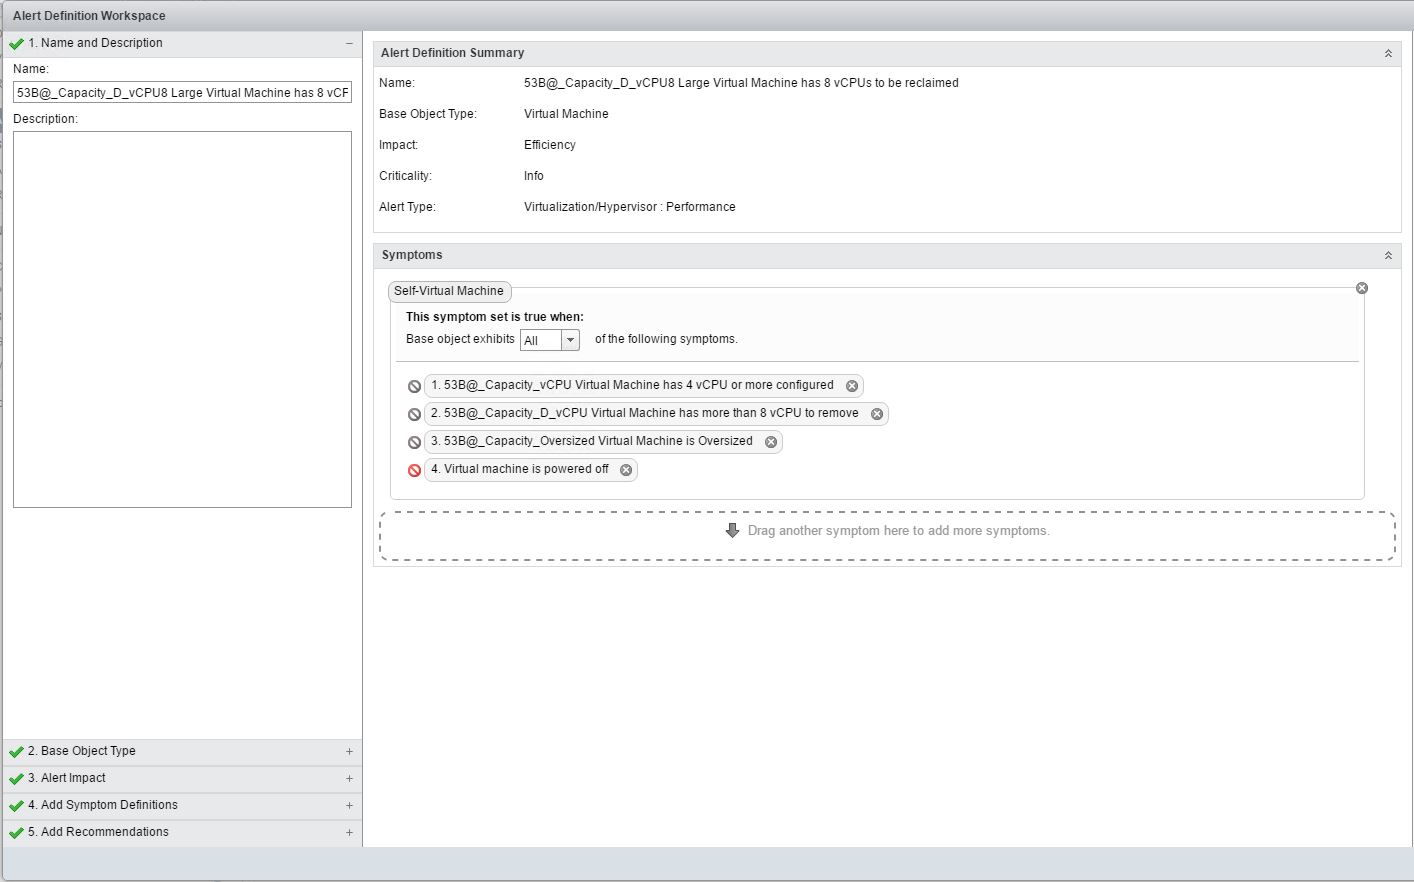
Custom Alert triggered when vROps recommends to remove more than 8 vCPU.
If you asked me why I prefixed all custom Alerts and Symptoms names with 53B@_Capacity_, my answer would be that I wanted all of them displayed at the top of their respective lists in vRealize Operations Manager interface, which by default are alphabetically sorted.
Let’s go really quick through all the four Symptoms that form this Alert.
53B@_Capacity_vCPU Virtual Machine has 4 vCPU or more configured – I basically check of CPU|Current size in Units(s) Metric as I’m not interested in “small” (below 4 vCPU) VMs.
53B@_Capacity_vCPU Virtual Machine has more than 8 vCPU to remove – This is what makes this alert tick, value of CPU|Recommended number of vCPUs to Remove Metric is compared to number 8.
53B@_Capacity_Oversized Virtual Machine is Oversized – I check Summary| Is Oversized Metric here, this is synthetic flag, that becomes 1 if vROps analytics engine determines that a VM is oversized, I included it because (quite obviously) we don’t want to downsize VMs that are overall not Oversized (even if some other vROps analytics thread believes vCPU count is too high for this one).
Last but not least, the only default (non-custom) Symptom in this Alert.
Virtual Machine is powered off – which is one of the least ergonomic things I’ve seen in vRealize Operations Manager, I had to negate it just to make sure that only powered-on VMs are taken into account (you can see that little “no parking” sign in front of this Symptom is red rather than gray.
The Alerts to detect condition when 2 or 4 vCPUs are recommended for removal are configured in similar way.
Let me show you a fragment of PowerCLI code, where I retrieve these Alerts, count them and present as a value ready for output.
Connect-VIServer -Server vcenter.seba.blog -User powercli_bot -Password XxXxX
Connect-OMServer -Server vrops.seba.blog -User powercli_bot -Password XxXxX

$VM = Get-VM -Name "OverSizedVM"

$OMAlertsCPU = $VM | Get-OMResource | Get-OMAlert | ?{($_.Name -like "53B@_Capacity_D_vCPU*") -and ($_.Status -eq "Active")}

if ($OMAlertsCPU) {

	switch ($OMAlertsCPU.count) {

		"3" {$CPURecommendationNo = "-8"}
		"2" {$CPURecommendationNo = "-4"}
		"1" {$CPURecommendationNo = "-2"}

	}

}
You can see in line 6, that I retrieve only Alerts of specific name, triggered and active for Resource Object representing our “OverSizedVM” in vRealize Operations Manager, then I count them in simple “switch” statement.
Again, because 8 > 4 > 2, when vROps recommends downsizing of any VM by 8 (or more) vCPUs, this configuration works like a gauge and Alerts for all three thresholds are “Active”.
Alternatively I could use a separate filter for each type of these Alerts, but I believe counting them is more “elegant” (and probably faster).
Identical logic is used to determine numerical value of how many GB of RAM should be removed from VM, the main difference is that instead of using CPU|Recommended number of vCPUs to Remove Metric, Memory|Reclaimable Capacity (KB) is used.
Once I got this part running, I couldn’t help myself and introduced symmetrical action, so included vROps recommendations to scale-up (increase number of vCPUs, or amount of RAM for VM) in the “good ol’ VM Inventory report”.
And it is very easy for vCPU, in my custom Alert definition I use Summary|Is Stressed (instead of Is Oversized obviously) and CPU|Recommended number of vCPUs to Add Metrics.
Things tend to get a bit tricky, when it comes to “extend RAM” recommendation.
Because I wasn’t able to find absolute Metric corresponding to such condition, I chose to observe the closest one I’ve found, which was Memory|Effective Demand(%), rather visibly a relative Metric, yet this is how I managed to make use of it.
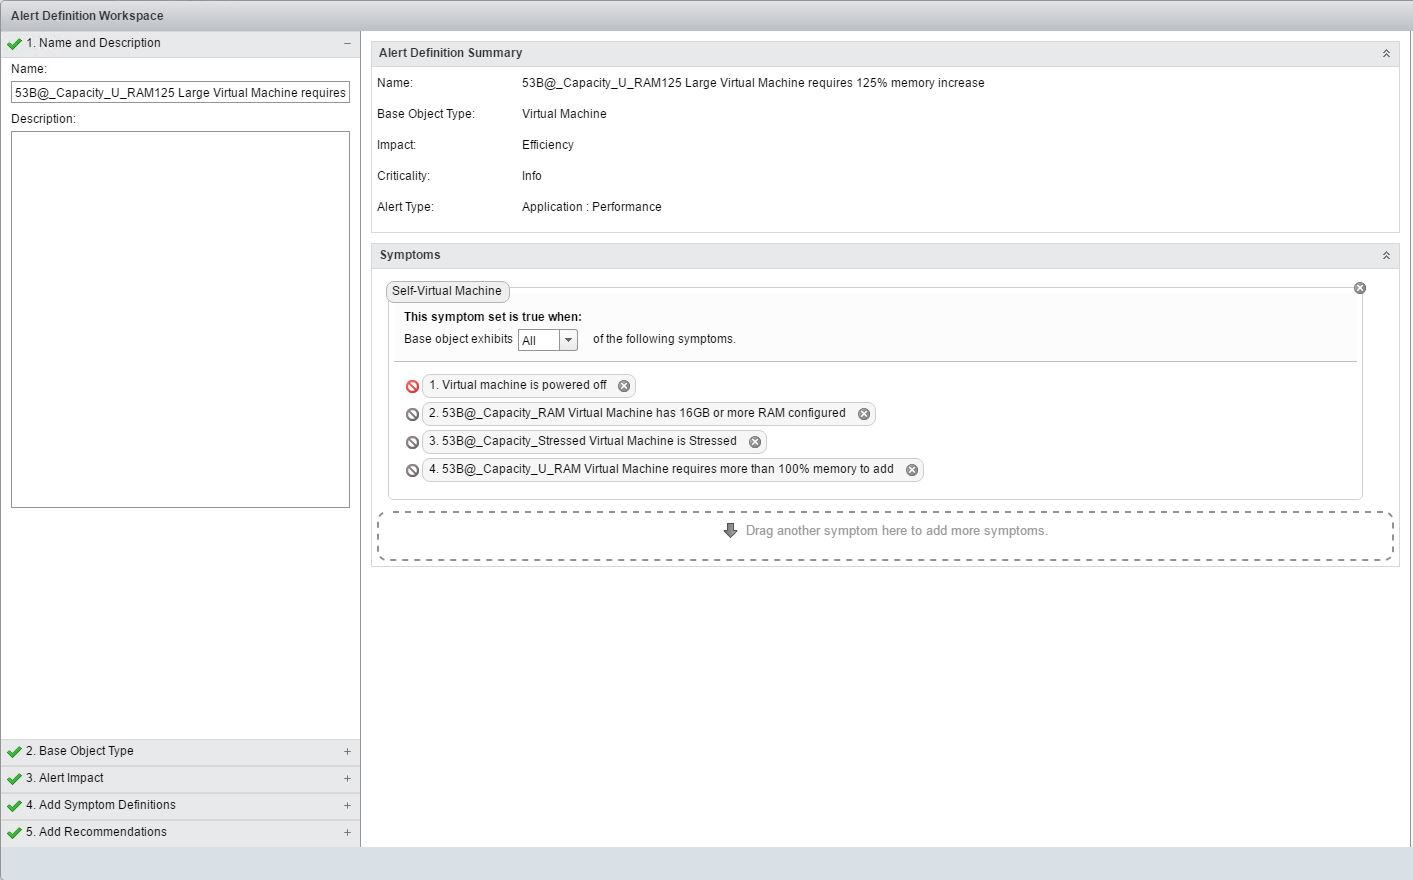
Definition of custom vRealize Operations Manager Alert triggered when “Memory effective demand” is greater than 200%.
Logic of the symptoms defined is “symmetrical” to the “downsizing” case:
Virtual machine is powered off – NOT!, because I only care about VMs actively consuming host resources.
53B@_Capacity_RAM Virtual Machine has 16GB or more RAM configured. – because again, I don’t care about “small VMs” (which in my case means: “configured with less than 16GB of RAM”).
53B@_Capacity_Stressed Virtual Machine is Stressed. – why bother with scaling-up of systems which are not “Stressed”?
53B@_Capacity_U_RAM Virtual Machine requires more than 100% memory to add – this is the key Symptom of this Alert, using aforementioned Memory|Effective Demand(%) Metric.
What I really liked about defining custom Alerts and Symptoms in vRealize Operations Manager, is that once you have them tested in your “lab” environment, you can simply export all custom Alerts from “lab” vROps instance and import into “production”, moreover you can do it at “Alert level” and all the dependencies (custom Symptoms and Recommendations) will be included as well.
PowerCLI code to retrieve this kind of Alerts can look like below:
Connect-VIServer -Server vcenter.seba.blog -User powercli_bot -Password XxXxX
Connect-OMServer -Server vrops.seba.blog -User powercli_bot -Password XxXxX

$VM = Get-VM -Name "UnderSizedVM"
$RAMSizeGB = $VM.MemoryGB

$OMAlertsRAM = $VM | Get-OMResource | Get-OMAlert | ?{($_.Name -like "53B@_Capacity_U_RAM*") -and ($_.Status -eq "Active")}

if ($OMAlertsRAM) {

	switch ($OMAlertsRAM.count) {

		"3" {$MemRecommendationGB = (Get-Memory2Add -CurrentRAM $RAMSizeGB -GrowthFactorPct 225)}
		"2" {$MemRecommendationGB = (Get-Memory2Add -CurrentRAM $RAMSizeGB -GrowthFactorPct 175)}
		"1" {$MemRecommendationGB = (Get-Memory2Add -CurrentRAM $RAMSizeGB -GrowthFactorPct 125)}

	}

}
You can see that final value of $MemRecommendationGB which is placed in the report is calculated against current $RAMSizeGB of our example “UnderSizedVM”, this is because Memory|Effective Demand(%) is a relative Metric and I wanted numeric (total number of GB to add) value to be present in the final report.
The short Get-Memory2Add function which “crunches” these numbers is defined as follows:
function Get-Memory2Add {

# Convert % of recommended RAM increase to GB

[CmdletBinding()]
Param(

    [Parameter(Mandatory = $True, ValueFromPipeline = $true, Position = 0)]
    [ValidateNotNullOrEmpty()]
    [int]$CurrentRAM,
    [Parameter(Mandatory = $True, Position = 1)]
    [ValidateNotNullOrEmpty()]
    [int]$GrowthFactorPct

)

Begin {

     #$function_watch = [Diagnostics.Stopwatch]::StartNew()

}

Process {

	[string]$result = ((([math]::round(($CurrentRAM * ($GrowthFactorPct/100) - $CurrentRAM)/8),1) | measure-object -Maximum).Maximum * 8)

	return $result

}

End {

    #$function_watch.Stop()
    #$spent_in_function = ($function_watch.elapsedmilliseconds)/1000
    #Write-Host "Time spent in Get-Memory2Add function $("{0:N2}" -f $spent_in_function)s, exiting"

}

}
If you wonder what’s all that “divide by 8”, then “multiply by 8” hassle about, well let’s say I’m generous and if I want to give a VM some more RAM, I want this “delta” to be an increment of 8GB.
While I don’t want to bother myself with adding 3 or 5 GB, you can easily change this function to return results with any “granularity” you prefer, depending on how much compute capacity headroom is available to you.
You can also see some commented-out sections that I typically use for “debugging”, sorry for that.
And this is how I incorporated vRealize Operations Manager compute sizing recommendations into my “good ol’ VM inventory report”.
It wasn’t all that difficult and I believe this method is rather flexible, you can go more (or less) granular with defining “buckets” of recommended values for your custom Alerts, by changing definition of respective Symptoms you can also decide whether to include VMs “smaller” than 4 vCPU / 16GB RAM.
From my experience with PowerCLI calls to vROps however, it seems they can be pretty time consuming, also the more VMs in scope of such custom Alerts, the faster your vROps database will grow, so you need to weigh all these factors in, perhaps you will even conclude to observe only much larger VMs (like above 8 vCPU / 32 GB RAM).
As I stated at the beginning, I have my “VM inventory report” scheduled weekly, so I gather these vROps sizing recommendations (together with many other properties of VMs) every Sunday.
But that doesn’t necessarily mean, that you should apply these recommendations every Monday!
One week is hardly a representation of a “business cycle” for any organization and you certainly don’t want to end-up in situation where you “over-regulate” your environment!
There is nothing funny in urgently scaling-up VMs you downsized last week, just because people from that particular project came back from 5 days long training and now immediately want to implement all the greatest and latest ideas they learned about.
In fact I’d recommend to save these weekly measurements (upload to some database maybe?) and review them monthly or even quarterly, before taking decision on any changes.
You can even wrap this around with another PowerCLI script, to help automate such review, but that’s a topic for completely different post.
I hope you will find this post useful, feel free to share it and I welcome you to provide any feedback you have in the comments!


I difficult understand what you configured metric for below , where do i need to configure , can you show the screenshot of symptom defination?
53B@_Capacity_vCPU Virtual Machine has more than 8 vCPU to remove – This is what makes this alert tick, value of CPU|Recommended number of vCPUs to Remove Metric is compared to number 8.