Nutanix Era (or simply “Era”) is a database management tool, designed to help customers, who run their databases on top of Nutanix Clusters, get the best of hyperconverged infrastructure during the whole database lifecycle.
If you are a Nutanix customer, I really doubt it’s the 1st time you hear about Era, as the product is making big waves for the last year, and it’s not even 1st post about it here.
However, if you’re not (yet) using Nutanix, or you were never really interested in anything beyond virtualization, this official blog is probably the best place to start discovering Era.
Another great resource is Nutanix University YouTube channel, where you can find demos of all main Era functionalities, like database provisioning, patching, cloning or backup and restore operations.
The unique added value of Era comes from combining typically siloed knowledge (infrastructure vs. database administrators) in a single tool, that automatically applies “full fan” of Best Practices during database provisioning and is able to utilize underlying Nutanix Distributed Storage Fabric capabilities, for cloning and backup purposes.
While Era is really powerful and versatile in its core functions, there is (still) some room for improvement in the “detailing” section, which gives people like me a chance to put together some scripts and write posts like this.
What I personally think Era (currently, as I strongly believe this is on the roadmap) lacks are (as you can probably guess from the title) more-than-basic reporting capabilities.
When navigating Era’s HTML5 interface you can find a list of databases: Or list of Era Time Machines, like below:
 (A Time Machine is just a fancy name for object controlling retention of snapshot based backups that Era is taking for your databases, a flexible combination of SLA and Schedule basically 🙂 ).
But while you can simply export each of these tables straight to JSON or CSV file, in reality all those focused views lack completeness, you get just the list of databases for example, but there is no immediate reference to corresponding database server (a VM in Nutanix cluster).
That was the main reason I decided to write a PowerShell script which would attempt to grab, combine and export all the information available from different parts of Era interface.
As it soon turned out the technical challenge wasn’t as big as I worried.
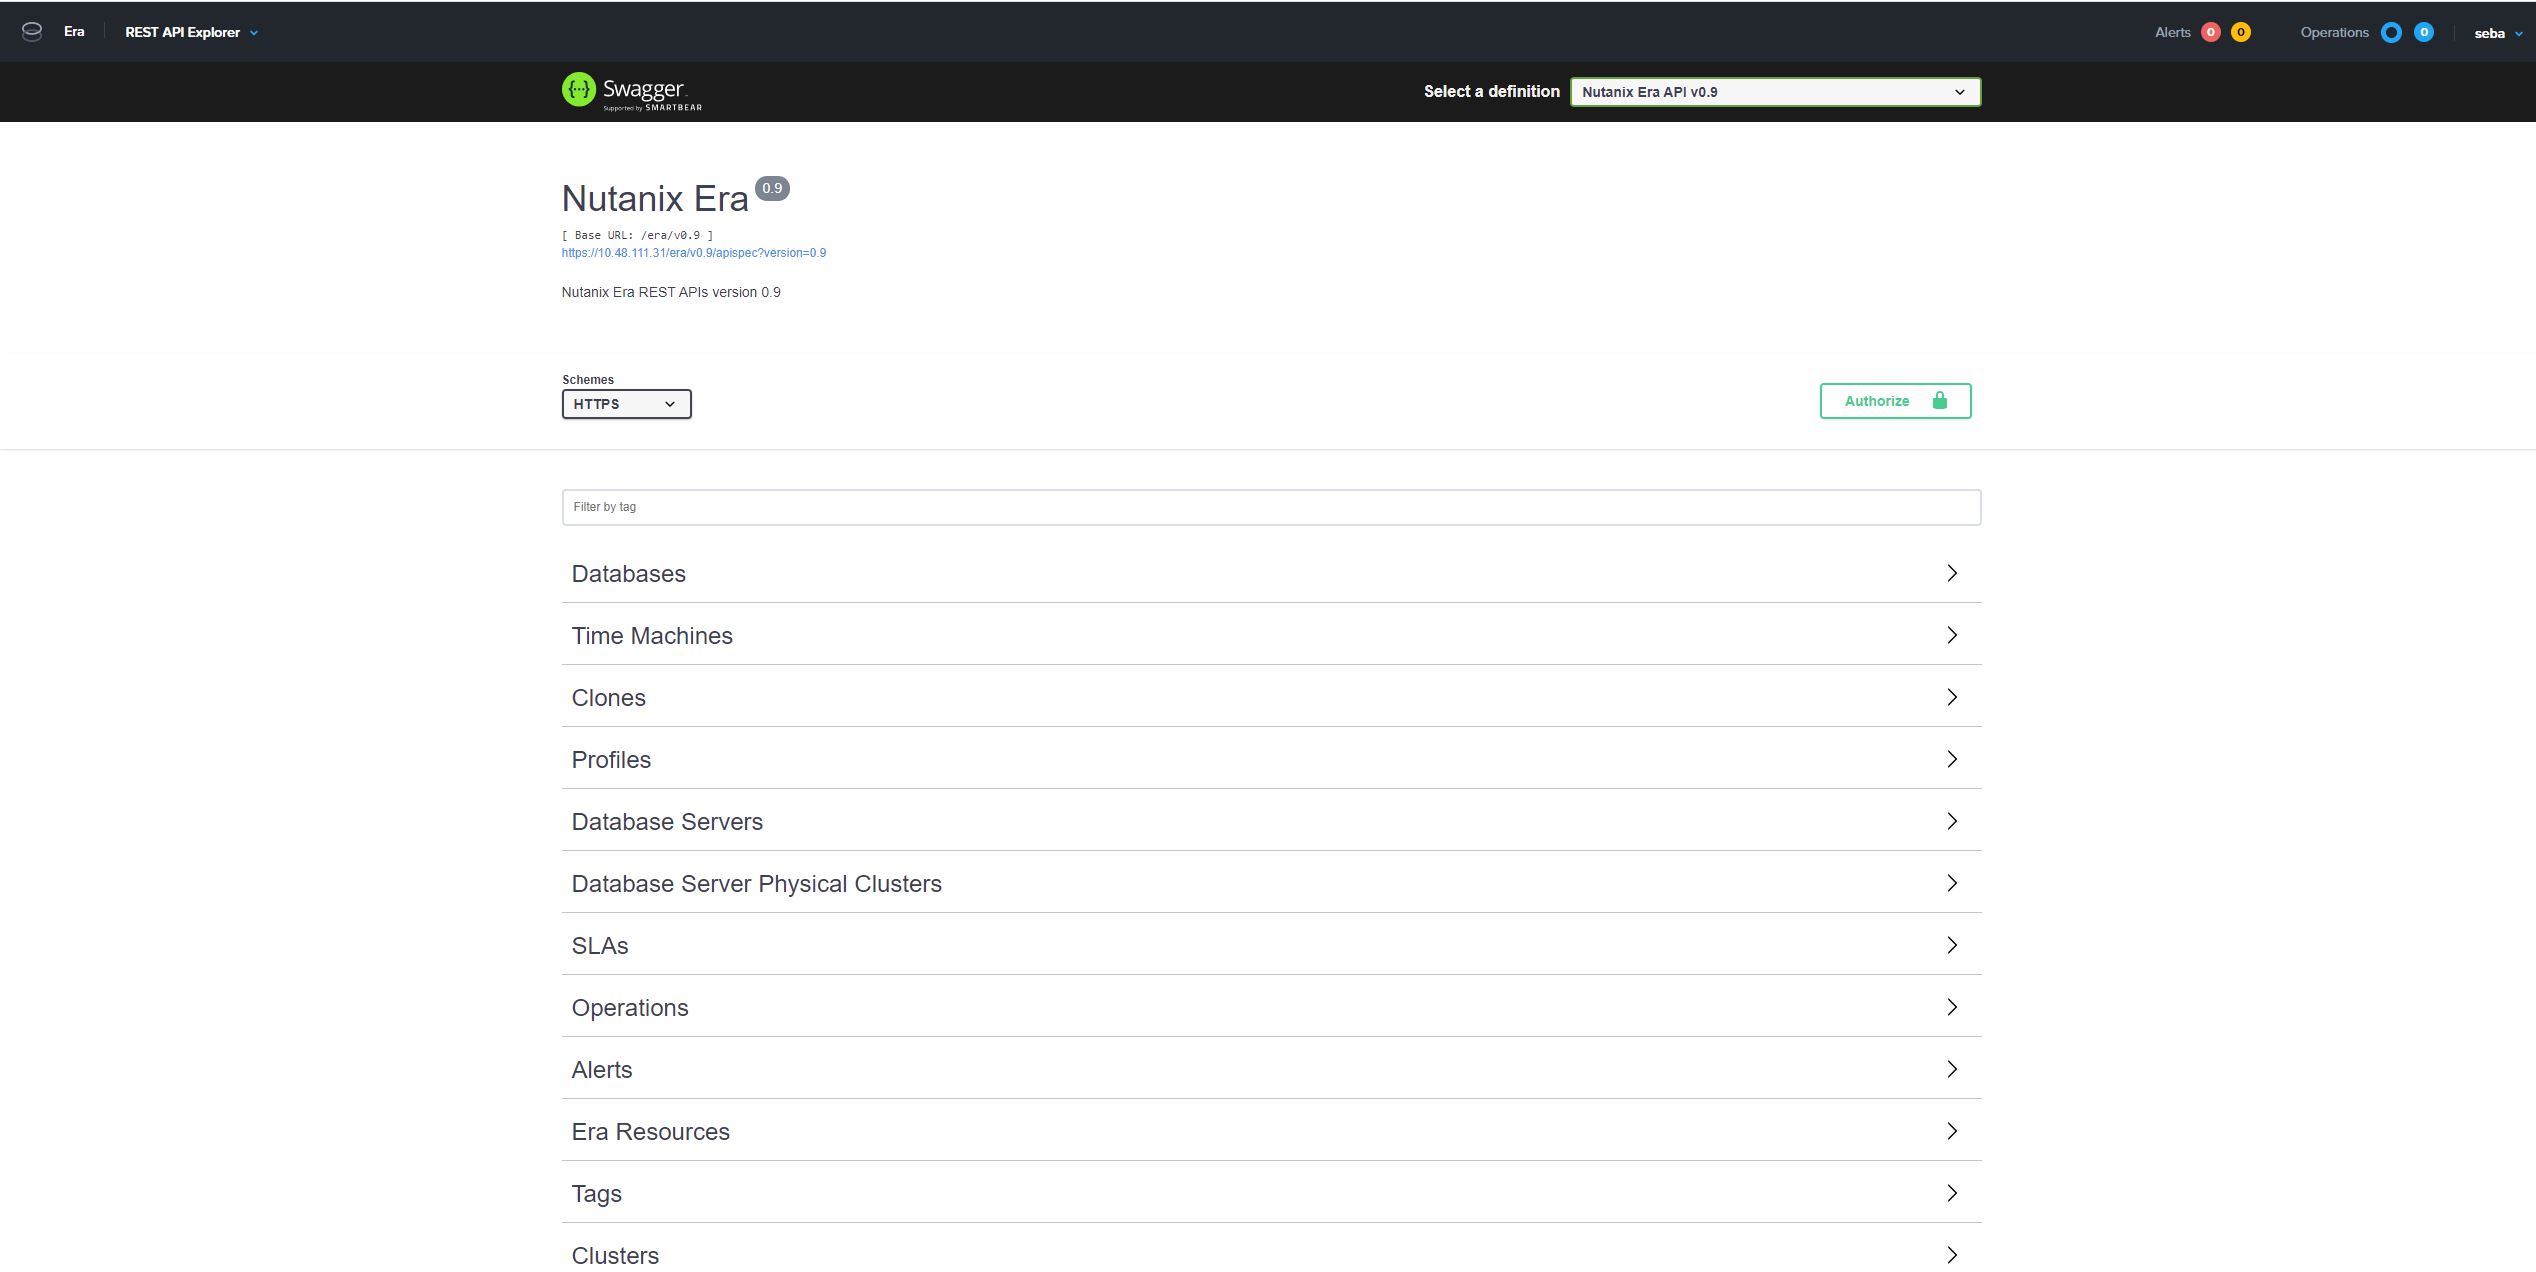
Era, like all Nutanix software follows API-first paradigm and offers REST API explorer, which is more than helpful in composing and testing API calls required to generate our report. The challenge here was more conceptual, as with great flexibility comes the difficulty of drawing simple pictures of any environment.
Era supports two most popular proprietary database engines (Oracle and MS SQL) as well as open-source engines like PostgreSQL, MySQL or MariaDB, it even supports SAP HANA!
Supported databases can come in standalone or clustered flavors, on top of that each database can have multiple clones, which makes compiling all this information into a single, tabular report a bit tricky.
Now that I think about it – maybe that’s the reason reporting is not really there in the interface 🙂
Finally, I decided to build my report around databases and cross check information from /databases? REST API endpoint with information from endpoints like /tms? (Time Machines), /clones? and /dbservers?.
You can find (and download) the (current version of) Get-EraDBListRestAPI.ps1 script from the public part of my GitHub.
Expected result is a CSV file which name should start with whatever was provided (IP address or hostname) as EraServer parameter and after importing (and accordingly transforming!) this raw output to Excel, you should see something like that: There are few “limitations”, or as I prefer to call them “characteristics” of this script anyone who wants to try it should be aware of.
In case of clustered databases (db_isClustered = TRUE) only a single cluster node (VM) will be included in the report – the one currently hosting the instance being inspected. This is direct result of “design decision” to focus the report around databases.
In case of databases, which happen to be clones (db_isClone = TRUE) I wasn’t able (yet) to find or properly calculate the size of the clone, this part remains on #TODO list.
Be careful when loading the CSV to Excel, as results may vary depending on your regional settings and you probably don’t want PostgreSQL version 10.4 to be reported as “one hundred and four”.
You should also be aware, that due to “database ownership” model implemented in Era, you really need to be Era “SuperAdmin” to be able to get the complete report of all databases registered with Era, any user with lower privilege level will be only able to list databases he/she “owns” (so created).
Last but not least – due to limited lab resources I wasn’t able to test this script against Era Multi-Cluster installations (where Era server controls multiple Nutanix Clusters) or MS SQL AAG and FCI instances – that’s one of the reasons the script is provided as-is with no warranty explicit of implied.
As always – I hope you find this post useful, feel free to share it and provide your feedback!


[…] second post about Nutanix Era doesn’t constitute “a series” yet, but we can be off for a good […]