My second post about Nutanix Era doesn’t constitute “a series” yet, but we can be off for a good start!
Era is the tool to go with, for anyone, who wants to run databases on top of Nutanix HCI.
I takes away many complexities and bottlenecks of database lifecycle management. Deploying, cloning and patching of databases are truly 1-click operations with Era.
The product in my opinion is delightful to the level of being… dangerous.
Allow me to explain this below.
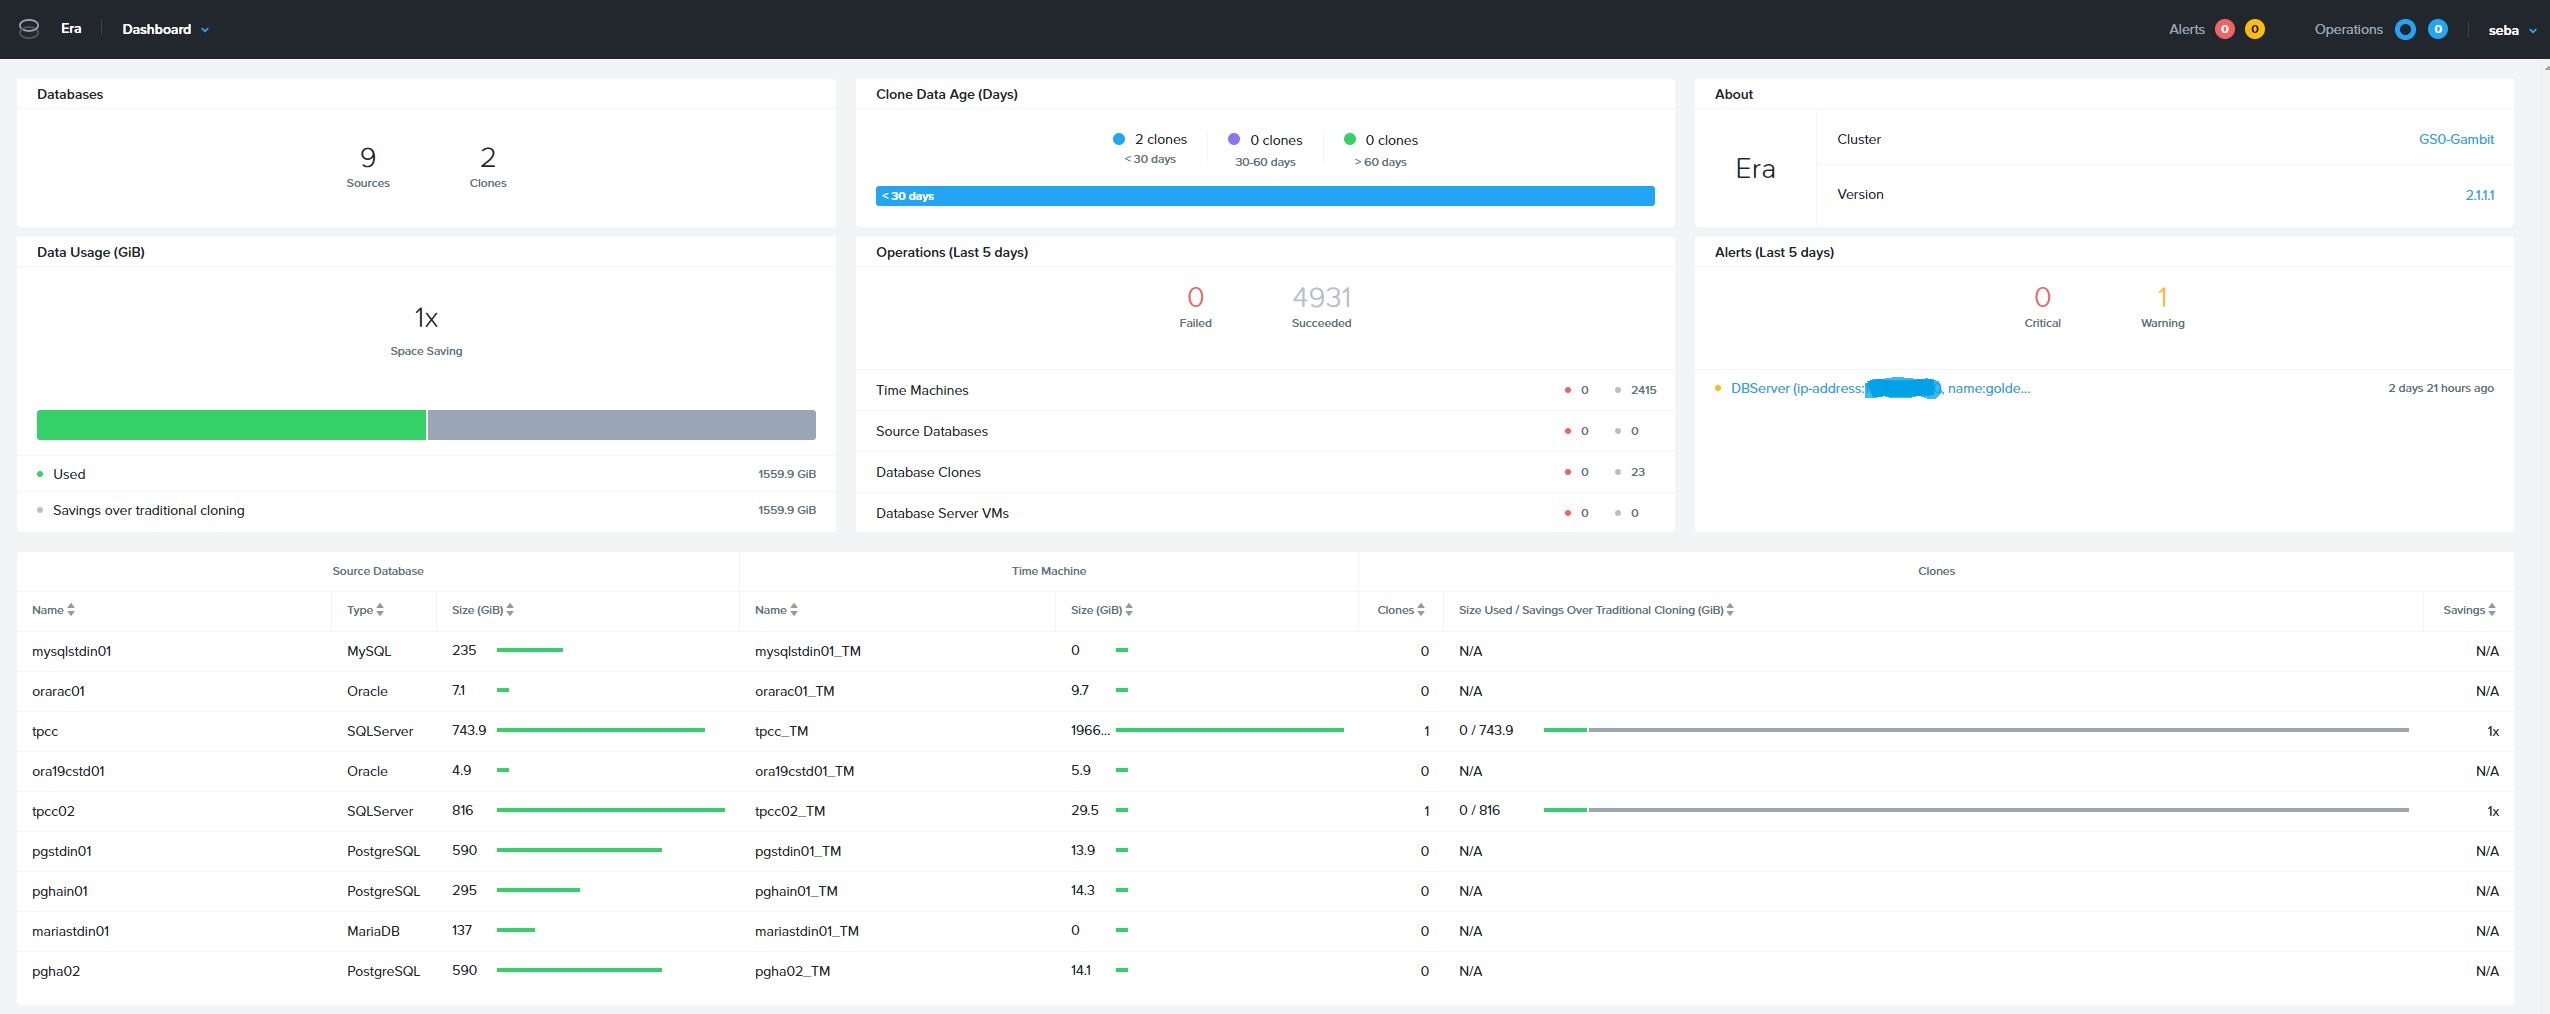
Operator working with Era gets a great deal of dashboards with information about databases and database server VMs registered in Era, like the main screen below.
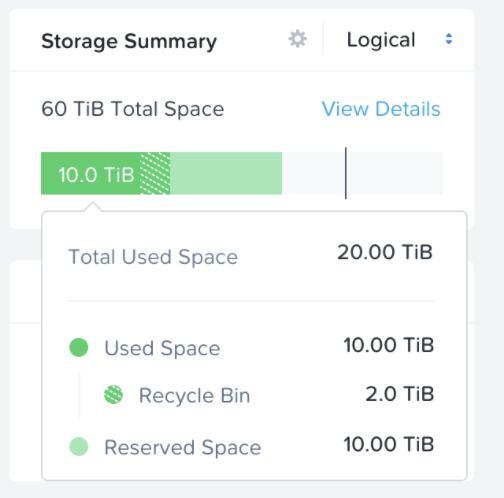
Unfortunately it is not (yet?) very easy to find information about capacity of underlying Nutanix Cluster(s) in Era WebUI, so in some of my worst nightmares I could see overenthusiastic Era users deploying the last breath out of virtualization hosts that run your database VMs.
This risk is probably not that relevant in situation where clusters registered with Era are dedicated for databases – which is a best practice, but in the real world customers will sometimes go for shared clusters, hosting different kinds of workloads, and the last thing you want to hear is that “Era workloads hoarded all cluster resources” and impacted some other services.
It turns out that Era has a built-in safety, to prevent over-provisioning of the cluster with database VMs. There are two thresholds implemented, one for storage and the other for memory usage, both thresholds are checked right before provisioning of database server VMs starts, and if requested configuration would cause breaching any of them, the provisioning operation stops.
One way to verify the value of resource configuration thresholds is Era’s REST API Explorer, and as you can see below, the default setting enforced during Era deployment is 95% utilization for both storage and memory configured.
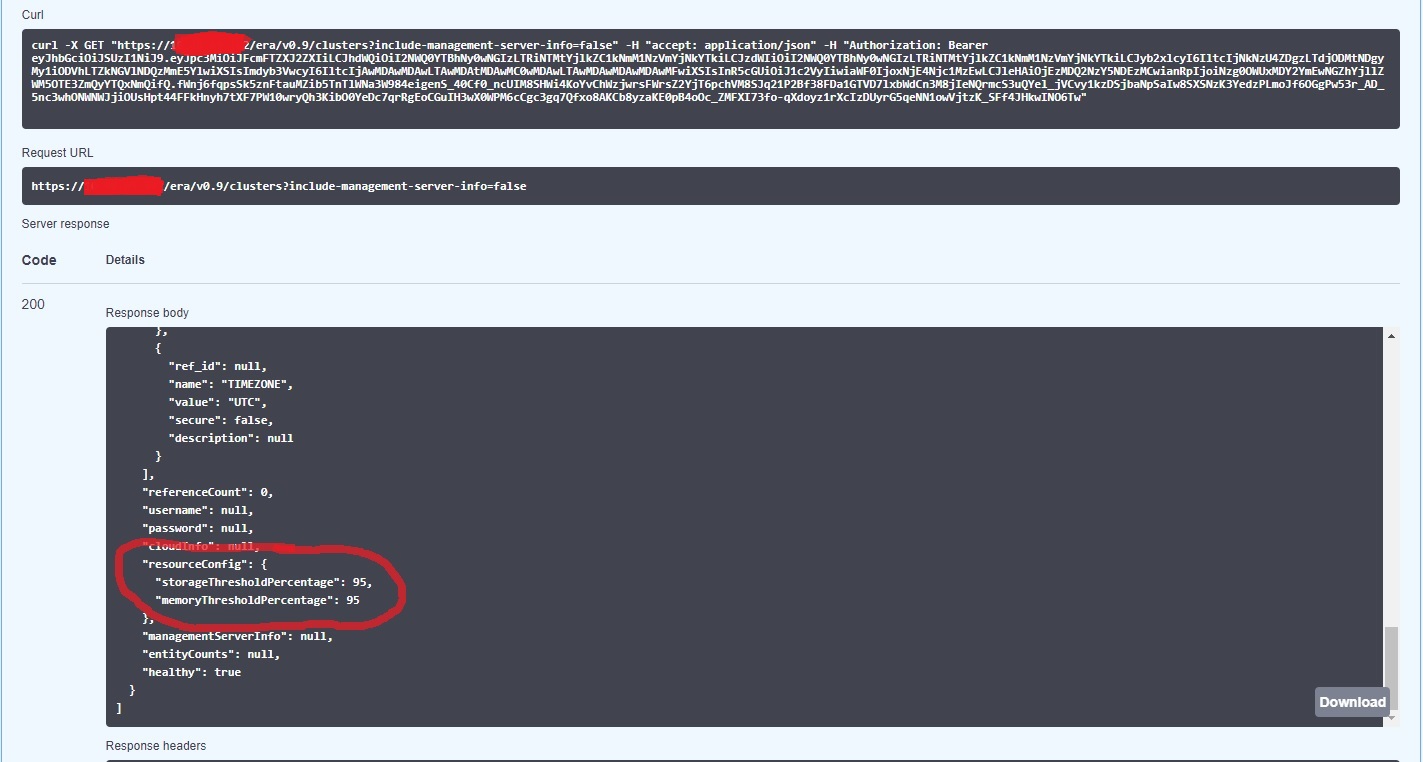
95% seems like a rather high value, that you might want to reduce, and you can do that either with REST API call, or using era-server CLI like below.
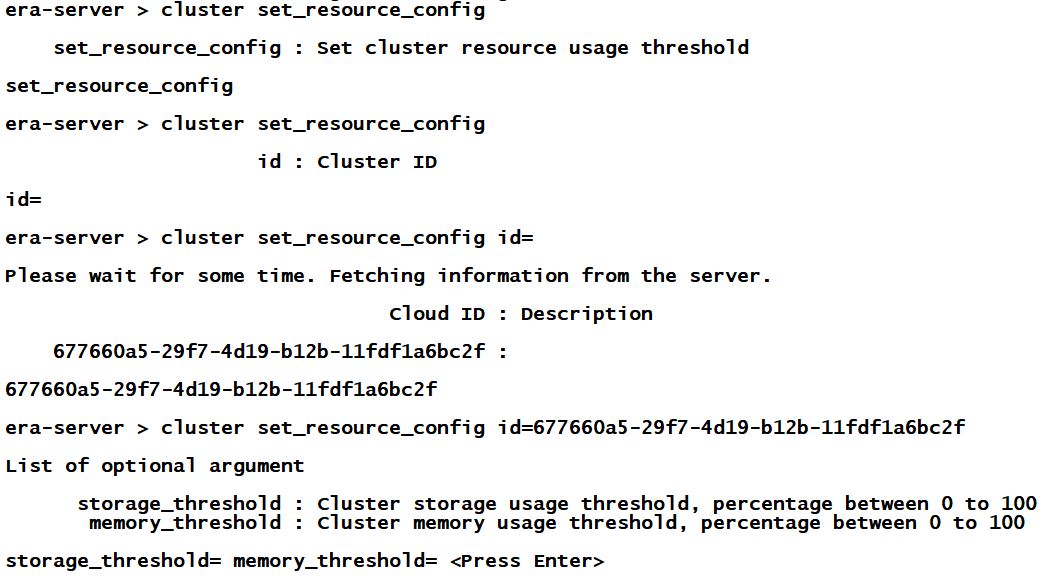
BTW – probably just to confuse the industry, Era comes with two different CLIs, era-server to manage Era’s own configuration and era to manipulate registered databases.
The take away here is: be sure you understand how those thresholds work, before you decide to change them. These are not any kind of “static limits” for Era, but both of them are actively checked before each provisioning operation, so if your cluster with shared workloads currently runs at 80% of memory utilization and you decide to lower Era’s memory_threshold down to 75%, you will not be able to provision any new database from Era, because the threshold is already breached!
Credits due for clarifying this to me go to my colleagues from Era team: Jagan Reddy and Harjit Singh .
Working intensively with Era for last few months, I put together a PowerShell script, that would not only retrieve Era thresholds for me, but also check what are the current memory and storage utilization percentages. On top of that the script checks if any of VMs in Nutanix Cluster are configured with vCPU count or vRAM size values larger than NUMA boundary of underlying hardware.
You can download the script from my GitHub and a sample output can be seen in the picture below.
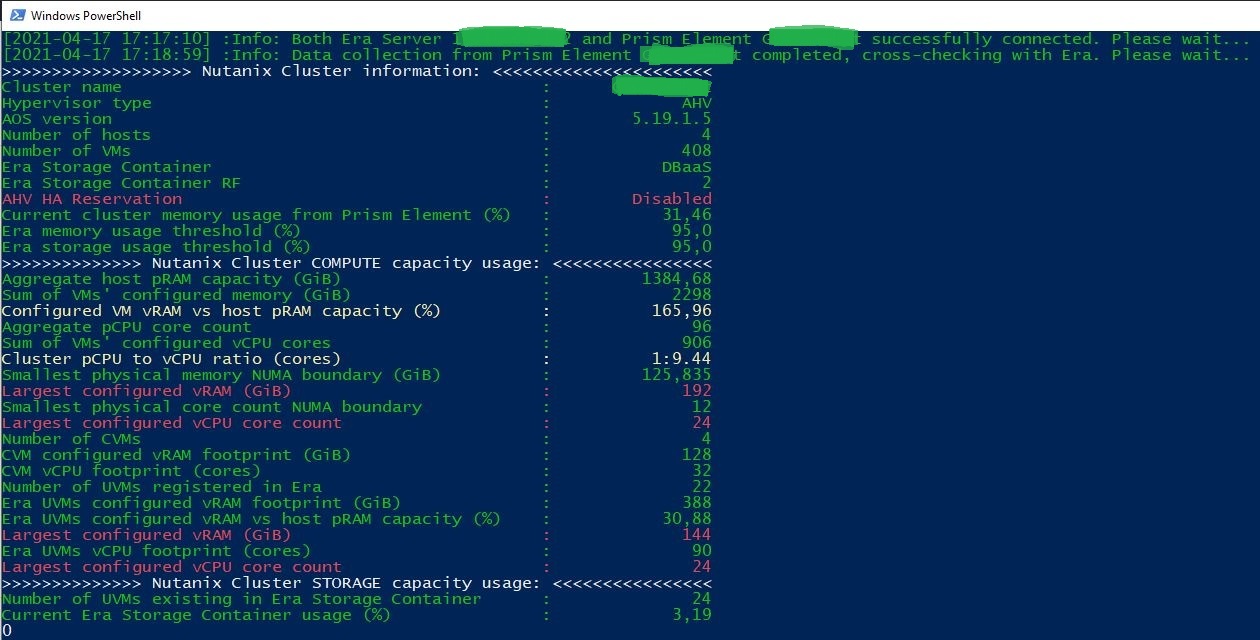
The script will need (and ask for) login credentials for both Era Server and underlying Nutanix Cluster, as some information needs to be cross-checked between Era and Prism Element, for example VMs which do not belong to Era, can exist in Era Storage Container, and they will still affect the storage threshold discussed above.
One limitation of the current script’s version is that it doesn’t work with Era Multi-Cluster setup (where Era manages databases across more than one Nutanix Cluster) – I simply don’t have a lab large enough to test it with multiple clusters, just like I wasn’t yet able to test it with ESXi as hypervisor.
Script makes a total of 8 REST API calls, to different endpoints and different versions of Prism Element API too (kudos to my colleague David Zoerb, for pointing out that “best version of API to gather VMs configuration is v1”!). It’s bound to take a while, before the results are displayed, especially for clusters with hundreds of VMs.
In example above a setup of 400+ VMs (most of them powered-off clones however) was tested and it took the script about 3 minutes to complete, using -DebugModeOn switch you can verify, that the script is sitting in gathering the list of VMs stage for the longest part.
I’m well aware, that this script has lot of room for improvement, for example I got “Unexpected EOF” exception a few times when testing with 400+ VMs, probably the best way to query /PrismGateway/services/rest/v1/vms/ endpoint would be to retrieve VMs in batches, just like Stephane Bourdeaud does in some of his very inspiring scripts.
The script only reads information and doesn’t change any settings, so it will not break anything except for crashing itself in scenarios I wasn’t able to test. That’s already a reason good enough to share it without any warranty or support, neither implied nor explicit.
As always – I hope you find this post useful, feel free to share it and provide your feedback!